When I started graduate school at Bard College’s Center for Environmental Policy (CEP), I also started my student employment with Bard’s Office of Sustainability as the “energy intern.” Less than a year ago, I would have laughed at the prospect of me working with energy data.
Me? I’d just spent two years living in the middle of the Colorado Rockies, immersed in the outdoors. I was preoccupied by gardening, ecology, and conservation. I didn’t even know the keyboard shortcut commands for “cut” and “paste.” Technology and energy data were not things I considered often.
But I needed a job. And I’m relentlessly optimistic so, even though it was astronomically out of my comfort zone, I knew I’d figure it out.
Living up to expectations: data management is complicated

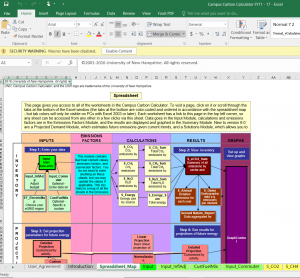
One of the first weeks in the office with my patient supervisor, Dan Smith (Bard’s Energy Manager and a Bard CEP alum), I was frustrated with our fuel data. I had one spreadsheet of raw delivery data, consisting of 9854 entries of 8 fuel types, that I had to cross reference with a spreadsheet that listed 116 fuel delivery locations at Bard. The raw data was organized by several different naming conventions, each different from Bard’s location naming scheme, and then I needed group the locations by which of Bard’s 4 meters they fed. Confused? Overwhelmed? I was too.
As I was scrolling through the spreadsheets, I exclaimed to Dan, “This is ridiculous. Do you really think I can figure this out? I don’t know the Excel functions to sort this, or if they even exist!”
Dan just looked at me and said, “You can’t manage what you don’t measure.” Since then, I’ve thought about my energy data job in a different way. (I later looked up the quote and realized he was paraphrasing Peter Drucker, a business management guru.)
I’ve always identified as an environmentalist, but what I had never thought about before is that, behind the scenes, people are doing the tedious work measuring the numbers in order to manage day-to-day environmental impact.
And data management is really challenging. It may seem easy for “techy” people, but I don’t think it’s really “easy” for anyone. It’s messy, slow, and requires constant error checking and troubleshooting.
Sorting the campus’ data has been a puzzle, but it’s weirdly satisfying when the column of a 500 fuel deliveries, sorted by fuel type, fiscal year, and meter, adds up to the reported number. I’ve literally cheered in the office at some of these breakthrough moments.
Despite the challenging parts, I love knowing that all my work is contributing to the creation of Bard’s first Energy Master plan. My examination of the campus’ current energy use will help evaluate the potential of various energy conservation measures. The implementation of these measures will lead to a reduction in greenhouse gas emissions, and ultimately move Bard towards its goal of carbon neutrality by 2035.
It’s helpful for me to keep this big picture in mind as I pour through the details of Excel sheets and energy bills. Below are few of the other big picture goals of the Energy Plan:
- Cost control and greater energy efficiency
- Reduced dependence on oil and propane, and reductions in associated greenhouse gas emissions
- Identification of end-of-life capital equipment and replacement strategies
- Review of energy purchasing/procurement strategies to align with the College’s financial and sustainability goals
- Understanding and forecasting the energy impact of proposed construction projects
Making a mountain out of molehills of data

I’ve grown to appreciate that data management is essential to building the better world I envision. Environmentalists like myself claim that we want a clean energy future… but now I have a better idea of what it takes to get there.
Energy effects so much of our day to day lives, yet most people don’t understand the fundamentals about how the system works, or even the numbers on their energy bills.
You may never have to organize facility energy data, but I urge you to look more closely at your own utility bills and consider what’s going on behind the scenes. Without data presented in an easy-to-read format, would you notice if changing your habits changed your energy consumption?
It may seem like a hard thing to wrap your mind around but, if I can do it, you can too. Only by standing on top of a mountain of data—properly formatted, error-checked, analyzed, and presented—is it possible to view the big picture.
