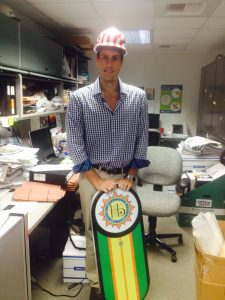
My name is Buck Doyle, and I am an accidental “Huge Policy Wonk,” or HPW. I never expected to become one, it just kind of happened. It dawned on me when I caught myself flipping through an article entitled, “Spatial distribution of US Household Carbon Footprints Reveals Suburbanization Undermines Greenhouse Gas Benefits of Urban Population Density” . . . and enjoying it.
I first dipped my toe in the wonky waters at the Bard Center for Environmental Policy (Bard CEP). As a young first year grad student, I studied a wide array of subjects—policy, econometrics, economics, law, science, geographic information systems (GIS)—all through an environmental lens. Now as a, slightly less young, second year grad student, I find myself wading waist deep.
Second year students at Bard CEP are required to do a 4-6 month professional internship, and I am several months into a joint internship in Los Angeles with the City of Hermosa Beach (Hermosa) and the South Bay Cities Council of Governments (COG) .
Hermosa is little city with big goals of carbon neutrality. For its municipal operations, it’s shooting for neutrality by 2020; for its community as a whole, by 2040.
Hermosa’s Mission: “The mission of the Hermosa Beach Municipal government is to be financially, environmentally responsible to govern the community and to provide 1st class municipal services in a customer friendly manner through valued employees and volunteers.”
The COG, on the other hand, is a joint powers authority. To be honest, I’m still not entirely sure what that means. But, in a nutshell, the COG is a collection of 16 cities that coordinate their authorities towards regional policy. (Hermosa is a member of the COG.)
COG Mission: “Provide a leadership forum for South Bay Local Governments to act collaboratively and advocate for regional issues with a focus on improving transportation and the environment, and strengthening economic development.”
In this blog post, I’ll be focusing on the Hermosa aspect of my internship.
 For Hermosa, I am creating a 2015 municipal emissions inventory. My task, essentially, entails accounting for the city’s municipal greenhouse gases from these 6 sectors: (1) Buildings and Facilities, (2) Street Lights and Traffic Signals, (3) Vehicle Fleet, (4) Employee Commute, (5) Solid Waste Facilities, and (6) Water and Wastewater Treatment.
As you are beginning to see, this task is a great big wonky onion with many layers. To meet the dual purpose of sparing you overwhelming wonkiness and to beat this onion analogy to death, I’ll only peel the first layer.
Identifying the emissions from any given sector starts with gathering something called activity data. Simply put, activity data quantitatively describes the usage of resources from which emissions are, well, emitted. The majority of Hermosa’s municipal emissions (buildings and facilities, streetlights and traffic signals, and water and wastewater treatment) come from the electricity and natural gas Investor Owned Utilities (IOU). In the case of the IOUs, the activity data (electricity and gas usage) just needs to be requested and then converted into emissions. Fortunately, the activity data for the Hermosa’s vehicle fleet is just as accessible. Fuel economy, make and model, and annual estimate miles are all recorded on an Excel spread sheet.
Unfortunately, the activity data for employee commute and waste aren’t as accessible. The employee commute data is being gathered via a survey on employees’ cars and commuting distance—easy enough. Lastly, for waste . . . well . . . I haven’t quite figured it out yet. But don’t worry, I will.
If you think this sounds arduous, then you are correct. Sifting through this disaggregated mess of data has been tedious and daunting, yet fascinating at the same time. Before entering local government, I always lamented the lack of climate action: “The UN just had its 21st international climate change conference (COP-21)? How many world summits do we need? Maybe by COP 53 we’ll start actually doing something.”
Now, after my time with Hermosa, I’ve become a little bit more understanding. Diving into the wonky weeds, having to identify the root source of emissions, and study the methodology of accounting for them has taught me how challenging it is just to figure out where our emissions are coming from and how much we’re emitting.
Not that I’m forgiving the glacial pace at which we’re addressing (or not) climate change. But I certainly have a better appreciation of the work that has been done to date.

